First of all, write a title in capital letters stating what we are representing: "European countries by GDP per capita", for example. Do not forget to write the source of our data, normally down and on the side, and the date of our data: "IMF, 2014", for example.
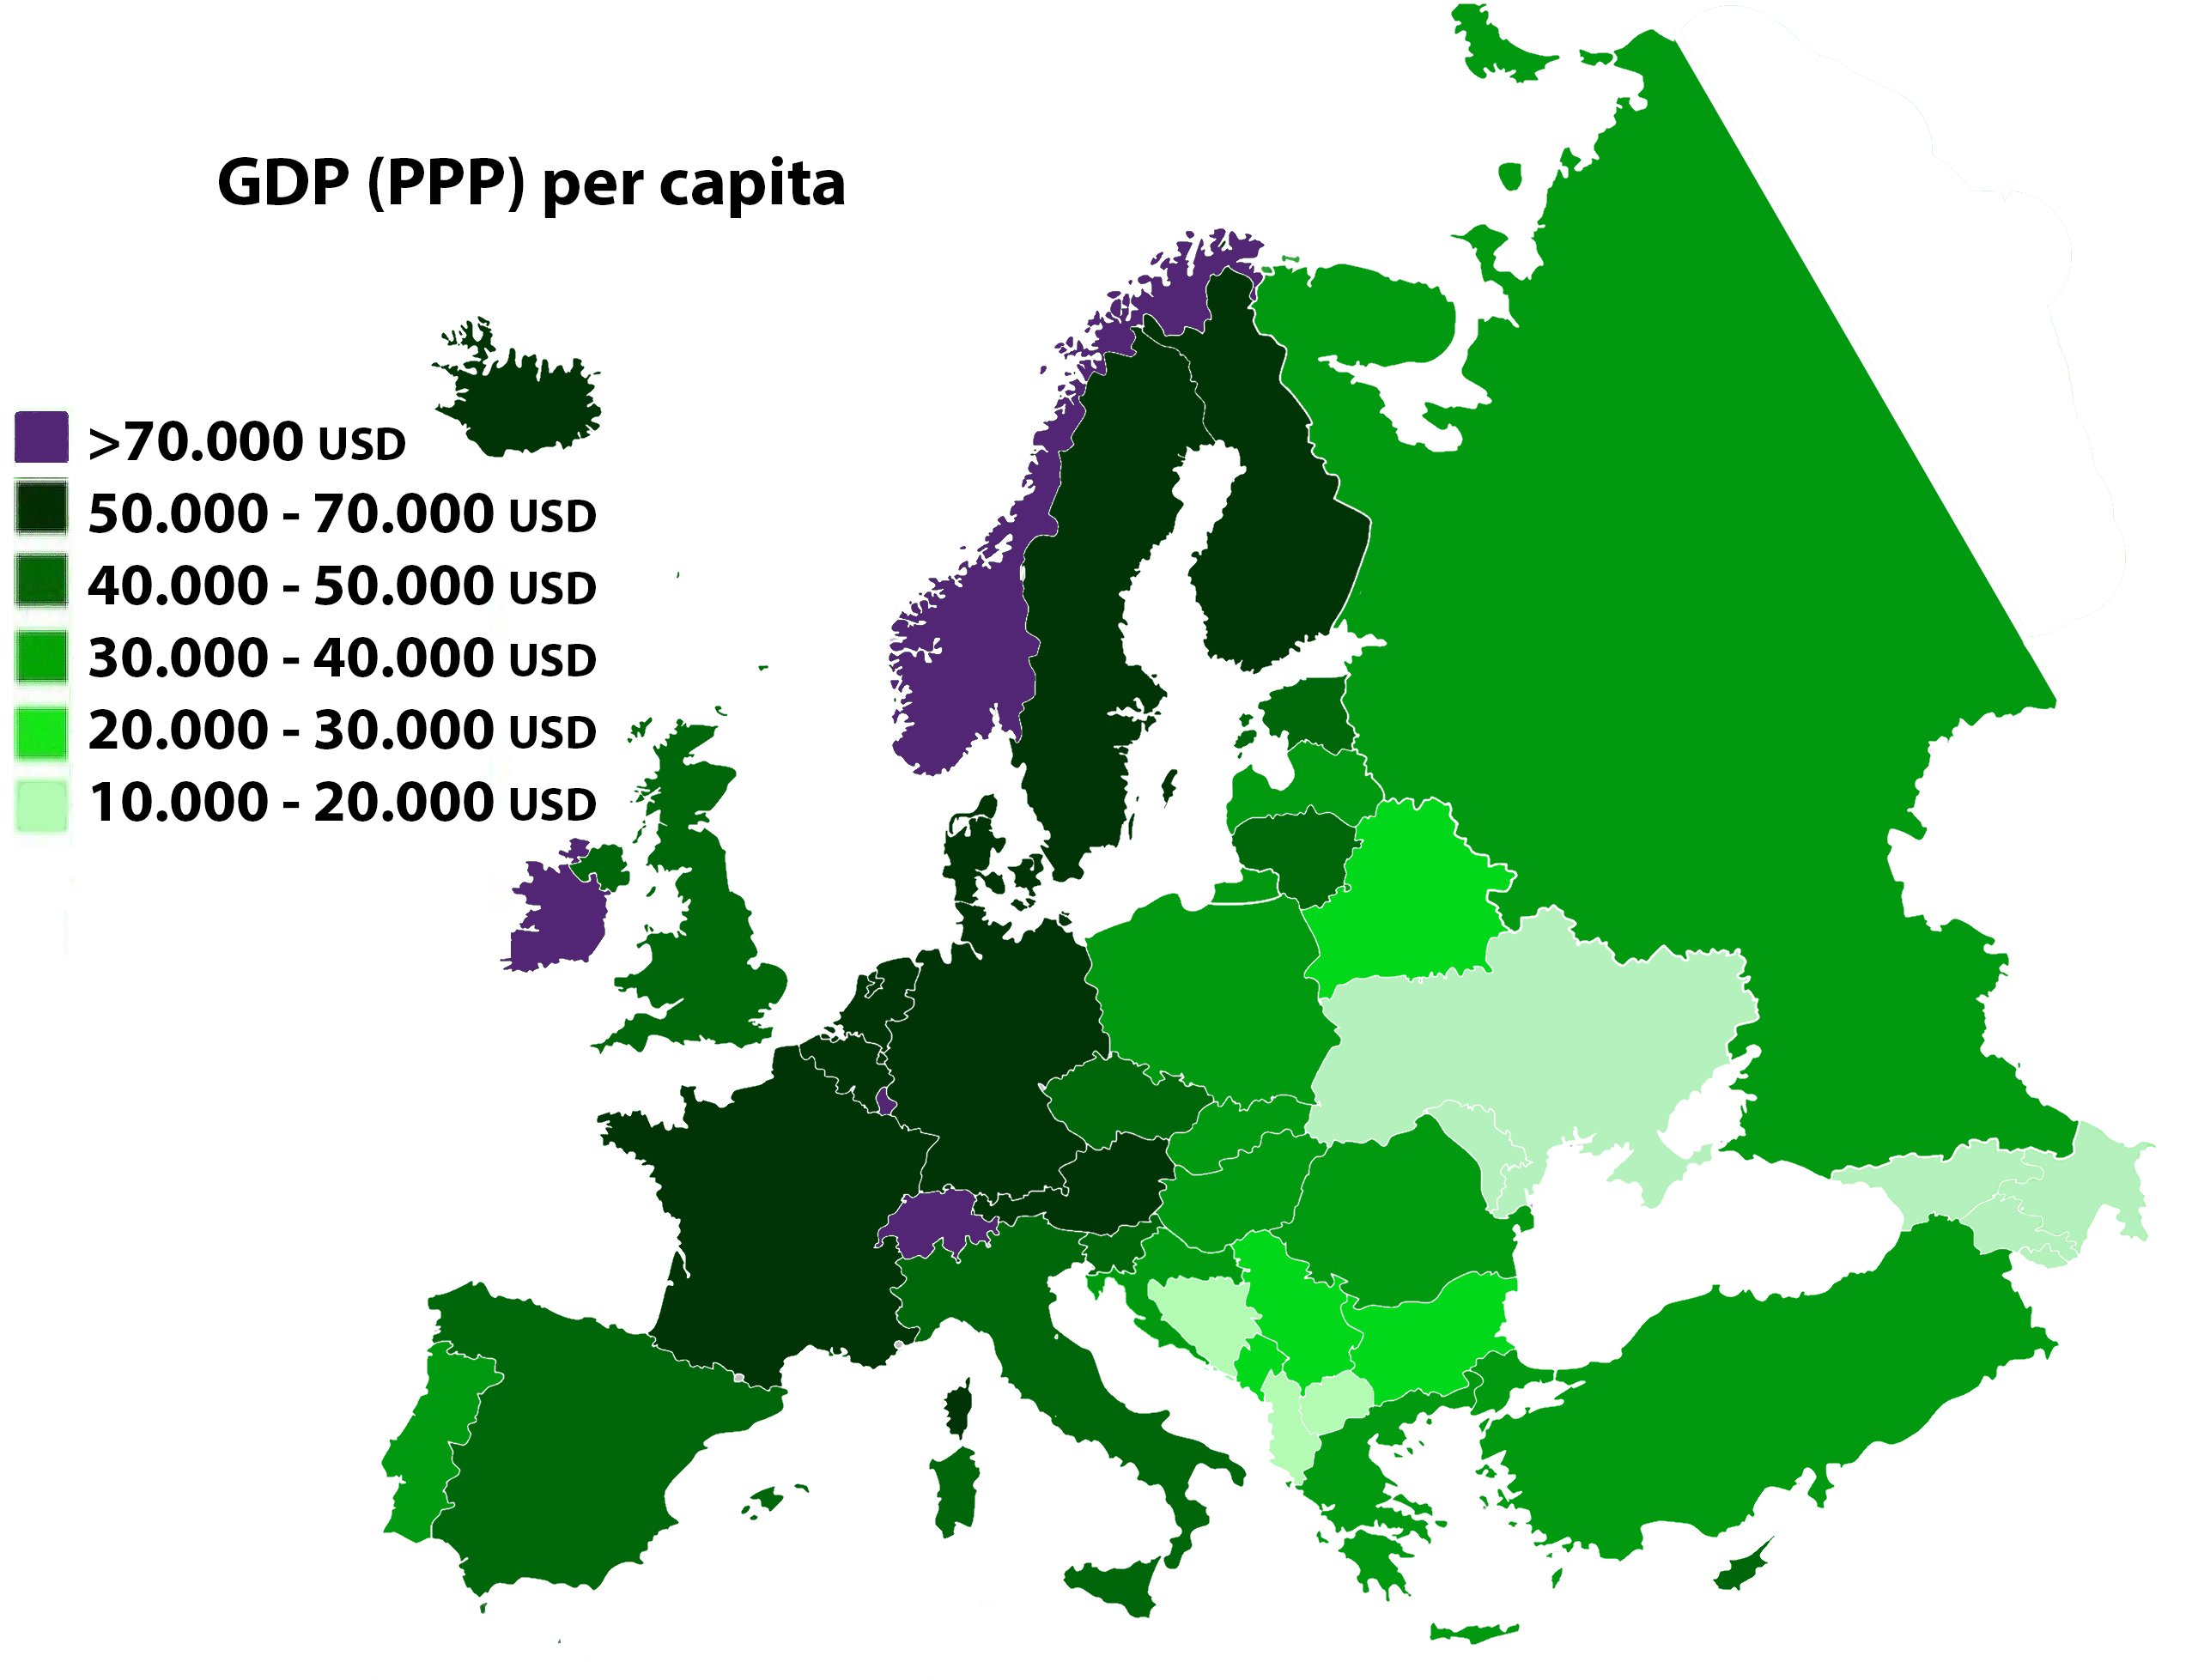
Classify European countries by GDP per capita establishing 4 or 5 categories according to their values in the table. Each category needs a colour to represent their values. As we are representing quantitative values, colours may better have the same type but different intensity (all green or blue, but lighter or darker). This classification has to be placed on the map for everyone to read it properly. Use Russia as background in this case.
The following map is ONLY an example, because it's probably NOT using the same data as us:
No hay comentarios:
Publicar un comentario